Production of milk-based products has increased by more than 60% globally over the last three decades [1] and is projected to grow faster than most other main agricultural commodities, over the next decade [2]. Yogurt in particular has seen an increase in popularity worldwide due to its potential health benefits [3].
One of the main challenges in yogurt production is to obtain products with desirable texture and stability. In this regard, the addition of whey proteins has been associated with an increase in creaminess and a softer texture, providing at the same time favorable nutritional properties, especially in low-fat yogurt. In order to understand the origin of these modifications of functional properties, it is thus important to determine the structural changes that take place throughout the production process of products with added whey protein.
Two of the main steps in the industrial processing of yogurt are pasteurization (heat treatment) and acidification. Small angle X-ray scattering (SAXS) is an especially suitable technique to study the nano- and microstructural evolution of such complex systems, in particular turbid samples (such as the ones resulting from acidification) which can prove challenging for conventional light scattering techniques.
Recently a group of researchers from the University of Copenhagen, the Technical University of Denmark, and Arla Foods used SAXS to study the interactions between three different types of whey protein ingredients and casein during both acidification and heat treatment [4]. A total of nine different samples have been designed and used in this study including a commercial skim milk sample (Com SM) and one reference skim milk (SM) mimicking the commercial one. Their composition is presented in the table below.
| Abbreviation | Total casein (LCC) [%,w/w] | Total whey protein [%,w/w] | LWPC [%,w/w] | NWP [%,w/w] | WPC [%,w/w] |
|---|---|---|---|---|---|
| LCC | 4.0 | - | - | - | - |
| LWPC | - | 4.0 | 4.0 | - | - |
| LCLW | 2.0 | 2.0 | 2.0 | - | - |
| W1 | 2.0 | 2.0 | 0.5 | - | 1.5 |
| W2 | 2.0 | 2.0 | 1.0 | - | 1.0 |
| N1 | 2.0 | 2.0 | 0.5 | 1.5 | - |
| N2 | 2.0 | 2.0 | 1.0 | 1.0 | - |
| SM | 2.8 | 0.7 | 0.7 | - | - |
| Com SM |
Table 1. Overview of samples and their casein and whey proteins contents. LCC stands for liquid casein concentrate, LWPC represents liquid whey protein concentrate, NWP is the nano-particulated whey protein, and WPC is the whey protein concentrate.

Influence of heat treatment on whey protein and casein
In-situ SAXS measurements have been performed at different times (0, 2, 5 and 10 min) on all samples during heat treatment at 90 oC. Since the two one-component systems (the casein only LCC and pure protein sample LWPC) are the building blocks of the remaining ones it is important to study their behaviour first in order to separate the contribution of different components. It is evident from the inset of Fig. 1 (a) that the internal structure of the LCC sample remains undisrupted. This is in accordance with previous findings showing that temperatures below 120 oC preserve the structure of casein at the native pH of milk (pH 6.7).
At the opposite end, the LWPC sample exhibits significant changes with increasing heat treatment time in particular in the low-q region. To interpret the data, a unified model combining a local ellipsoid shape with larger aggregates has been seen to produce an accurate modeling of the results. As shown in Fig. 1 (a) at 0 min the local elipsoid shape describes the entire scattering curve (a small upturn in the lowest q-values is an indication that a small amount of larger aggregates are beginning to form). As the heat treatment progresses the local shape of whey proteins is preserved but aggregation becomes more pronounced. The presence of a two size populations which increase in size (as described by the radii of gyration Rg1 and Rg2 extracted from the fit) as a function of heat treatement time indicates that most of the native whey protein aggregates into larger structures.
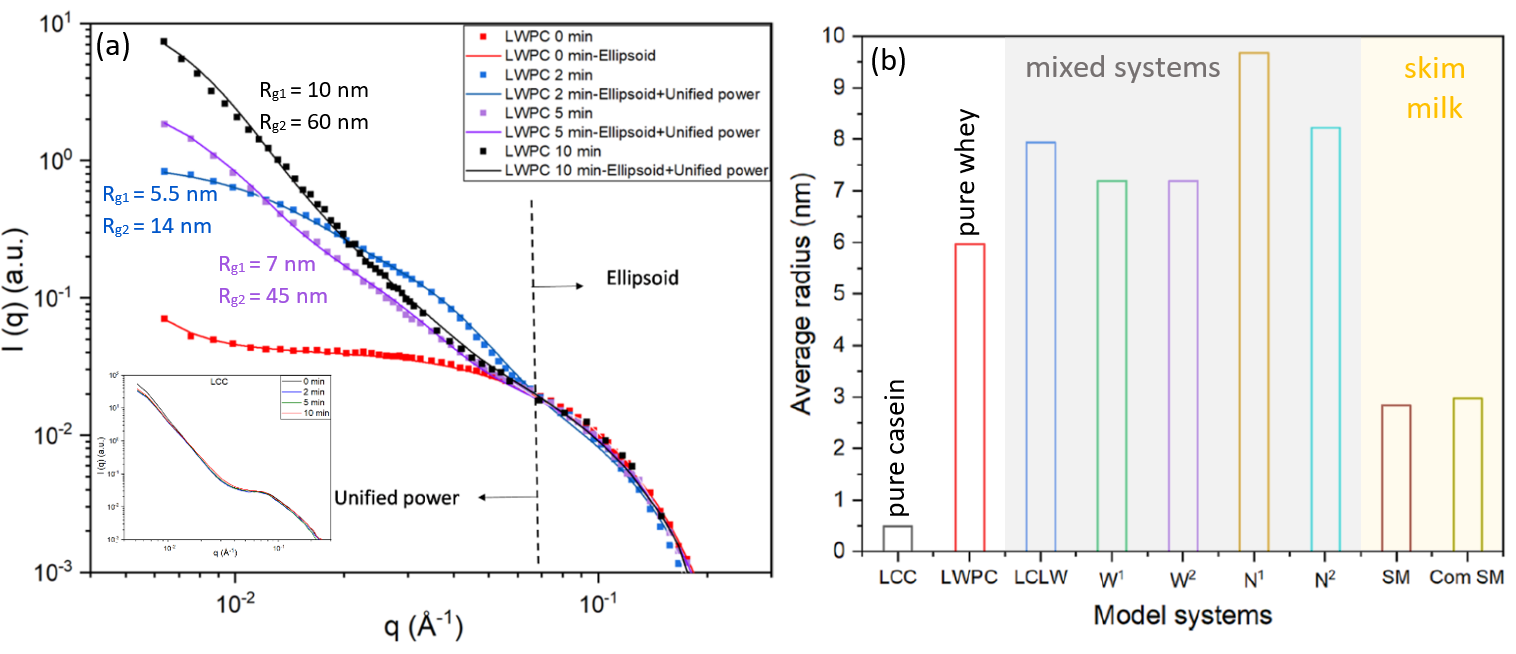
Fig. 1 (a) Background subtracted SAXS data of the pure whey protein sample and the casein only system (inset) recorded at various time intervals after the heat treatment (90 oC). (b) Average radius of different milk model systems obtained by fitting the middle q-range of the scattering curve (0.008 – 0.05 Å-1). Credit: Food Research International, 2022, DOI: 10.1016/j.foodres.2022.111292
For all the mixed milk model systems the most significant changes during heat treatment appear in the intermediate q-range (0.009 – 0.04 Å-1) and they are mainly ascribed to whey protein alterations given the lack of response observed in the LCC sample. By subtracting the 0 min curves from the scattering curves obtained at 10 min it is possible to isolate the aggregate contribution. Subsequent fitting of this q-region reveals the average radius of the aggregates which is then used to determine whether different whey protein components behave in the same way. As it can be seen in Fig. 1 (b), all mixed systems display larger average radii indicating that, in the presence of casein, more complex aggregates are forming that include also individual caseins. The highest average radius was obtained for systems with nano-particulated whey protein (N1 and N2). The origin of the larger aggregate sizes is attributed to small particles already aggregating before heating due to their higher surface area.
Influence of acidification on whey protein and casein
In the case of acidification, the effect of pH variations is also highly dependent on the presence of casein. However, the opposite trends in comparison with the heat treatment are observed, with the pure whey protein sample being essentially invariant to pH and casein containing samples exhibiting an overall intensity reduction and a gradual smoothing of the high-q features as a function of decrease pH.
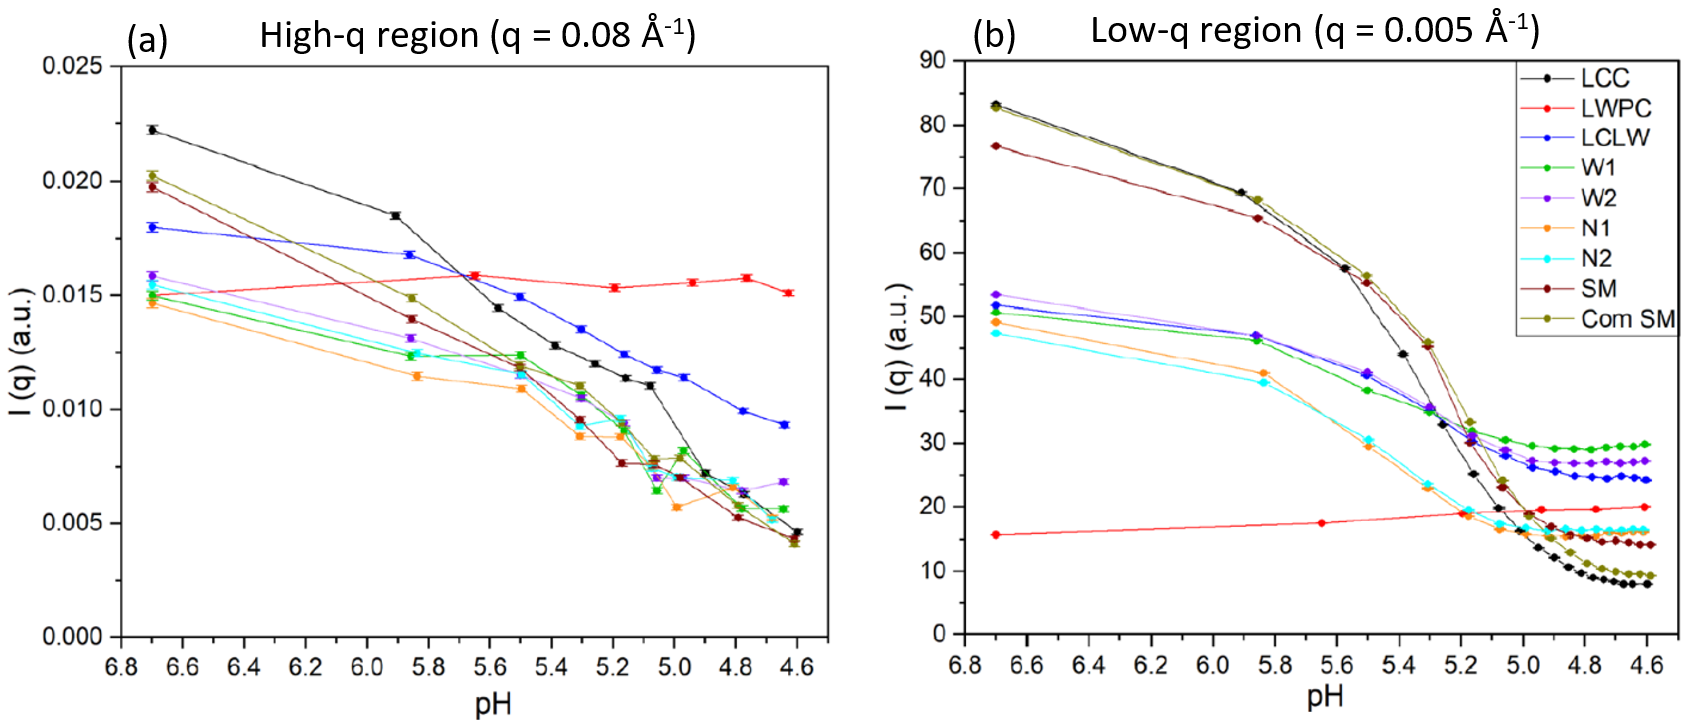
Fig. 2 Variations in the scattering intensity at the selected q values (a) 0.08 Å-1 and (b) 0.005 Å-1 as a function of varying pH during acidification of different milk model systems. Credit: Food Research International, 2022, DOI: 10.1016/j.foodres.2022.111292
When different q-regimes are analyzed, it becomes evident that the intensity evolution is rather different (as shown in Fig. 2). At high-q (Fig 2 (a)), a linear decrease in intensity as a function of increasing pH is observed for all systems though more pronounced in the casein only system and the two reference samples (skim milk and commercial skim milk). As for the low-q region (Fig. 2 (b)), a sharp decrease in intensity at the pH value of ~ 5.2 has been observed in all samples, this time again the behaviour being more pronounced in samples with the highest casein content. A mixture of effects, related to the size and number of objects and the variation of contrast, are responsible for this evolution. On one hand, increasing aggregates size would induce a lowering of the intensity as larger aggregates would sediment out of the X-ray beam. This is also supported by the less significant overall intensity reduction rates in mixed systems (compared to LCC, SM and Com SM) which is indicative of the formation of smaller casein-whey protein aggregates during acidification (compared to larger casein-casein aggregates). Contrast changes can be caused by a general disruption of the micelles as well as a release of the calcium from the casein micelles, which results in a more uniform protein solution.
Conclusions
This detailed small angle X-ray scattering study of the structural changes that take place in milk model systems during heat treatment and acidification revealed a very interesting mechanism of protein interactions. In general, the heat treatment was found to mainly affect the whey protein components while casein remained largely unaffected. The opposite behaviour was observed during acidification which affected primarily casein while whey components remained intact. For the mixed whey-casein systems, the overall behaviour could be understood as a mixture of the above effects. In addition, the form of the whey protein components is shown to influence the structure formation and dynamics.
The research was originally published in the following article: [4] Li, Ruifen, Tanja Christine Jæger, Tijs AM Rovers, Birte Svensson, Richard Ipsen, Jacob J. K. Kirkensgaard, and Anni Bygvrå Hougaard. “In situ SAXS study of non-fat milk model systems during heat treatment and acidification.” Food Research International 157 (2022): 111292.
[1] Food and Agriculture Organization of the United Nations, “Milk production”, Accessed June 17, 2022, https://www.fao.org/dairy-production-products/production/en/
[2] OCDE/FAO (2021), OECD-FAO Agricultural Outlook 2021-2030, Éditions OCDE, Paris, https://doi.org/10.1787/19428846-en.
[3] Yıldız, Neslihan, and Ihsan Bakırcı. “Investigation of the use of whey powder and buttermilk powder instead of skim milk powder in yogurt production.” Journal of food science and technology 56, no. 10 (2019): 4429-4436.
[4] Li, Ruifen, Tanja Christine Jæger, Tijs A. M. Rovers, Birte Svensson, Richard Ipsen, Jacob J. K. Kirkensgaard, and Anni Bygvrå Hougaard. “In situ SAXS study of non-fat milk model systems during heat treatment and acidification.” Food Research International 157 (2022): 111292.


