SAXS as a tool for characterizing monoclonal antibody-protein antigen interactions
Detailed biophysical description of antibody-protein antigens interactions is important for guiding physical characterization and molecular engineering of therapeutic targets. Proteins can undergo conformational changes or structural rearrangements upon ligand binding. X-ray crystallography and nuclear magnetic resonance (NMR) spectroscopy are used to determine atomic structures of stable protein-protein and protein-ligand complexes. However, these techniques are limited by the heavy glycosylation, flexibility, stability and size of complexes. Small angle X-ray scattering (SAXS) can be used to quantify conformational changes or structural rearrangements upon ligand (other proteins, DNA/RNA, carbohydrate and small compounds) binding in solution [1,2]. SAXS provides knowledge on the equilibrium state, the stoichiometry of binding and association and the dissociation process in near-physiological conditions.
Castellanos et al. [2] used SAXS and size-exclusion chromatography (SEC) combined with molecular modeling to study the interaction of anti-streptavidin monoclonal antibodies (ASA-IgG2) with tetrameric streptavidin (tSA). SAXS measurements were performed directly on bulk complex solutions (without fractionation), on collected fractions after SEC (complex fraction), or during in-situ coupled SEC-SAXS measurements.
Figure 1 demonstrates that: (A) the ASA-IgG2-tSA complex exhibits a higher intensity at low Q values (which is proportional to molecular weight) in comparison with the free components and (B) the main complex displays a longer Dmax value (regardless of the separation methods used SEC, Fraction or Bulk) than the two components. Moreover, the stoichiometry derived from SEC-SAXS experiment indicated that complexes with two ASA-IgG2 and two tSA molecules were the major components in the main fraction [2].
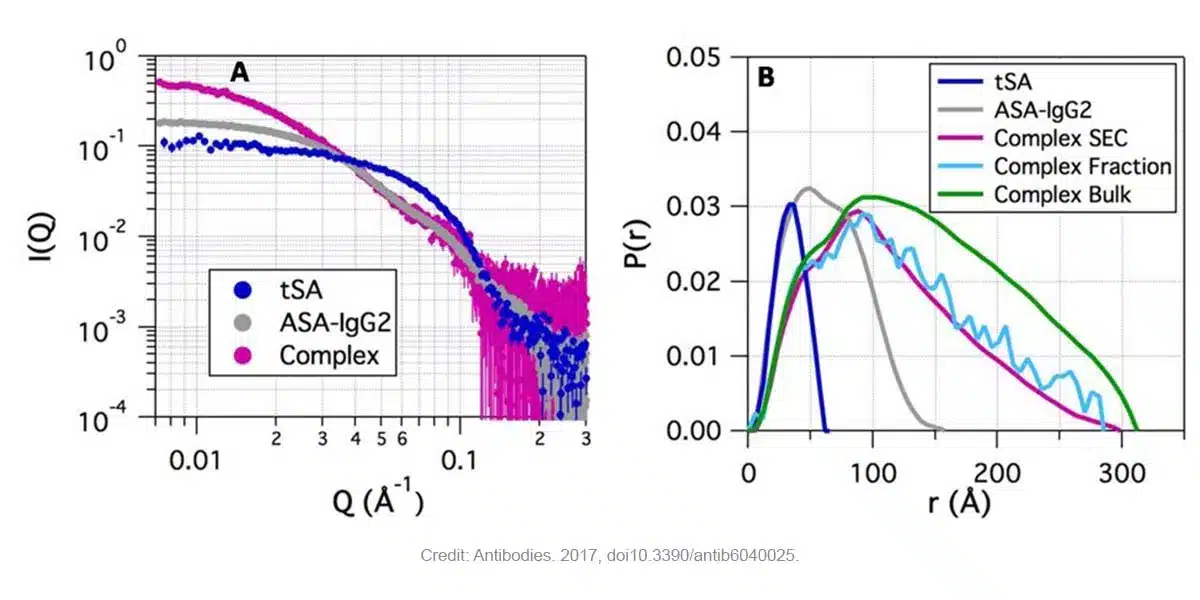
Figure 1. SAXS data of ASA-IgG2, tSA and ASA-IgG2–tSA complex at pH 6.5. (A) Scaled SAXS profiles for the complex and its components showing higher intensities at low Q for the complex, followed by the ASA-IgG2 and tSA (SEC-SAXS). (B) Pair distribution function P(r) for the ASA-IgG2–tSA complex and its components. Credit: images extracted from Antibodies. 2017. DOI: 10.3390/antib6040025.
The Kratky plot (Q2I(Q) vs Q) is a useful representation to qualitatively evaluate the flexibility and the folding state of the protein and protein-ligand systems. It provides a measure to assess changes in the conformation/folding state of the system upon ligand binding. Folded proteins exhibit parabolic curves, whereas unfolded proteins exhibit hyperbolic profiles.
Figure 2 shows a parabolic curve (bell-shaped, characteristic of globular proteins) for tSA and a non-parabolic curve for ASA-IgG2 due to inherent flexibility that has been reported for other flexible mAbs. Non-parabolic curves were also observed for the complexes. These differ in peak position at lower Q when compared with free ASA-IgG2. However, the low signal-to-noise ratio hinders the comparison in the higher Q range [2].
The stoichiometry and structures of ASA-IgG2-tSA complexes in solution were characterized using SAXS and molecular modeling. These results clearly demonstrate the capability of SAXS for characterizing protein-protein interactions in solution, avoiding the arduous task of protein-protein or protein-ligand crystallization, which sometimes require screening of thousands of different conditions, alongside artifacts produced by crystal packing.
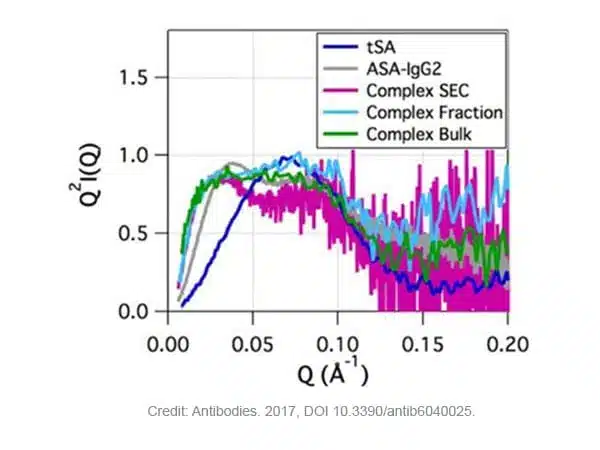
Figure 2. Kratky plot for the ASA-IgG2–tSA complex and its components at pH 6.5. Credit: image extracted from Antibodies. 2017, DOI 10.3390/antib6040025.
The research was originally published in the following article:
[2] Castellanos, M. M.; Snyder, J. A.; Lee, M.; Chakravarthy, S.; Clark, N. J.; Mcauley, A.; Curtis, J. E. Characterization of monoclonal antibody-protein antigen complexes using small-angle scattering and molecular modeling. Antibodies 2017, 6, 25‒44. DOI: 10.3390/antib6040025.
References
[1] Tuukkanen, A. T.; Svergun, D. I. Weak protein–ligand interactions studied by small-angle X-ray Scattering. FEBS J. 2014, 281, 1974–1987. DOI: 10.1111/febs.12772.
[2] Castellanos, M. M.; Snyder, J. A.; Lee, M.; Chakravarthy, S.; Clark, N. J.; Mcauley, A.; Curtis, J. E. Characterization of monoclonal antibody-protein antigen complexes using small-angle scattering and molecular modeling. Antibodies 2017, 6, 25‒44. DOI: 10.3390/antib6040025.
